John Wingfield in the “Dictionary of Milling Terms,” published by the International Association of Operative Millers in 1989, defines mill balance as “the proper distribution of stock to the various parts of the milling system, as determined by the flow sheet, to ensure proper loading of equipment and high milling efficiencies.”
He goes on to explain a variety of activities required to maintain proper mill balance, including changing break release schedules, changing purifier divide paddles, changing sifter cloth openings, or adjusting any number of other items either while the mill is running, or when the mill shuts down for repairs. Mark Fowler, former associate director of the International Grains Program at Kansas State University, suggests in an article published in the February 2012 issue of World Grain that flour moisture and extraction are measures that can determine efficiency and profitability of the milling system. He said the distribution or balance of the ground stock must be kept within the parameters of the system design to maximize mill performance as part of the balancing act measures.
This is the first in a series of articles to discuss in greater detail the development and utilization of the three tools mentioned by Fowler, including, but not limited to, checking the break release, creating the granulation curve and weighing the mill streams. The first topic to be addressed is measuring break release.
Mill Balance Measure Variability
It is essential in the discussion of mill balance and product distribution to understand that variability is endemic to any processing system and performance measures. A single observation is grossly inadequate to describe the “average” of a system measure as there is no assessment of system variability.
There are, of course, many sources of variation to any system outcome, but the sources can be identified in six categories, including Mother Nature, Mankind, Materials, Measurement and Machines, as described by Ishikawa’s Fishbone Diagram. Any single observation of a measure must be viewed with the understanding that the measure is but a snapshot in time and the measurement is one observation or sample that may lie below or above the population average.
Without multiple observations, the variability of the population is unknown, and the average cannot be defined. Changes to systems based on a single data point are therefore doomed to failure as they will increase system variability and will erratically move system average performance measures.
Break release is the measure of the amount of work performed during a specific break grinding passage. Break release is stated as the percentage of material passing through a specific size testing sieve and should be checked at least once a day or at a change of wheat mix.
The concept of break release, however, is not limited to the breaks and can be extended to great benefit into several coarse and sensitive products where a balance is required between recovery (yield) and quality (flour color or ash) such as D, R1, R2, R3, R4 (Sizings, Quality etc.).
Sampling
Samples for break release measurement are best taken under the roll, preferably at both ends and, if necessary, the middle. Uniform performance along both ends and center of the mill will increase product uniformity and wear uniformity maximizing roll life.
The sample should be taken as close as necessary to the nip of the roll to ensure the entire product stream is caught and the sample is representative. The discharge from the grinding zone is not directly down in a linear fashion and typically flares out at the discharge with coarser stock directed down and finer stock thrown further away from the vertical drop.
Some millers collect materials in tube-like devices directly under the roll nip and assess both break release and density, while others use longer scoops further away from the grinding line for safety reasons.
Some roll manufacturers have designed sampling devices that collect a representative sample without entry into the roller mill. No matter the device or method used, one is encouraged to look at sample collection methods and procedures to minimize variation in sample uniformity including sample size.
The best option regarding sample size is to keep the size relatively small so as not to overload the test sifter and use the sample in its entirety rather than taking a portion of the sample. Sample size can be controlled by container volume and/or the amount of time the sample is taken. A sample size of 100-200 grams to be sieved on a test sifter with 530-930 cm2 sifter surface should be appropriate.
Use of the entire sample is suggested due to the potential of segregation of sample in handling and potential to discard material that would alter the representative nature of the sample collected. It is rather unlikely that one could dispose of a portion of a sample without disturbing its representative nature.
Clothing Size
The clothing size selected for measurement should be limited to reduce the potential of using an incorrect test sieve. The test sieve used should reflect the nature of the grinding process being monitored. A smaller aperture opening would be appropriate for fine or later break performance measure as indicated by John Wingfield in Break Release/Extraction Survey, in the March 1988 Technical Bulletin from the International Association of Operative Millers.
As previously mentioned, various grinding operations may be evaluated using the break release method where critical. Therefore, a selection of sieves would be appropriate for measuring and evaluating product granulation and sifter performance.
Breaks generally can be evaluated on screen sizes of 0.630-4.00 mm with semolina granulation measured between .125-1.120 mm and flour sifting performance between 0.075-0.200 mm.
The size spread between sieves should be minimal if the data is to be used to develop granulation curves to evaluate proposed clothing changes in the milling process.
Sifter Motion And Time
The test sifter should have throw (diameter of gyration) and speed (RPM) like that of the mill sifters. Break stocks generally reach their sifting end-point quickly, requiring only 20 to 60 seconds to achieve a reasonable sifting endpoint.
Appropriate sifting time can be identified by sifting in 10-second time increments and determining when less than a 1% change in through stock based on the original sample weight has been identified, with the sample screen remaining clear and no fines observed in the over tail. Finer materials sieved on smaller screens may require longer sample sifting times to achieve the endpoint and provide meaningful measurement.
In some cases, a sieve cloth cleaner or other cleaning device positioned on the screen as well as held on a back wire below the screen may be necessary to obtain a meaningful and repeatable performance measure.
Conducting The Break Release Test
When conducting a break release test, it is important that the stock flow into the roll grinding area is uniform in both quantity and quality across the roll length. Non-homogeneity of the quantity and quality of material across the roll length suggest other issues exist that impact mill balance and product uniformity. If it is a quantity issue, the feeder gate and/or speed may require adjustment. If it is granulation or quality difference from one end of the roll to the other, it may be an upstream sifting issue and/or failure of spouting installation to provide stock homogeneity. In either case, the problem should be corrected to provide uniform product flow and quality across the roll length.
In roller mills where stock and/or flour accumulates on surfaces in the sampling zone (shrouds/brushes/scrappers) and drops off frequently, gentle tapping may be required to ensure retained material does not find its way into the sample container during sample collection and alter test results.
The sample should be weighed and placed in the sample sifter in its entirety as suggested and sieved with the sample sifter cover on for the time determined to be appropriate as described above. The weight of the overs can be measured and subtracted from the original sample weight to estimate the weight of the through stock that can be expressed as a percent of the original sample weight.
The weight of the overs can be expressed as a percent of the original sample and subtracted from 100 to estimate the percent of through stock, leaving the through stock in the collection pan to expedite the next test. Leaving the through stock in the pan does have its limits as the through stock accumulation can fill the pan and move back through the screen during testing, potentially affecting test results.
Careful observation is needed to ensure this does not happen, particularly when testing stocks containing lots of flour or fine material. Alternatively, the weight of the through stock could be measured directly and expressed as a percent of the original sample weight. Modern scales can be programmed to handle the calculations to eliminate math errors.
Method development and training are an essential part of conducting break release or other grinding performance tests. That it is the purpose of the test: to assess system and material variability rather than operator variability so uniform methods and measurements conducted by well-trained operators will reveal machine, material and environmental sources of variation that may or may not be controllable.
Training Impact
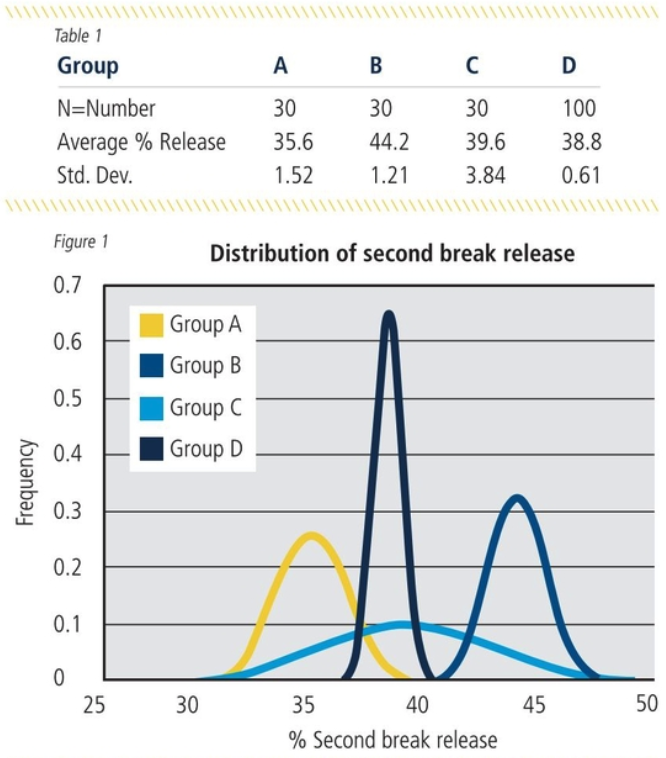
Table I shows the results of training/not training or regulating groups of individuals charged with the responsibility of measuring second break release in a flour mill.
Group D was trained and was instructed to collect 100 sample measurements while other groups were instructed to collect 30 samples of second break release without specific instruction. Collected data was used to create a frequency distribution by group for second break release as shown in Figure 1 (left). Differences between the group variability and estimated average second break release are clear.
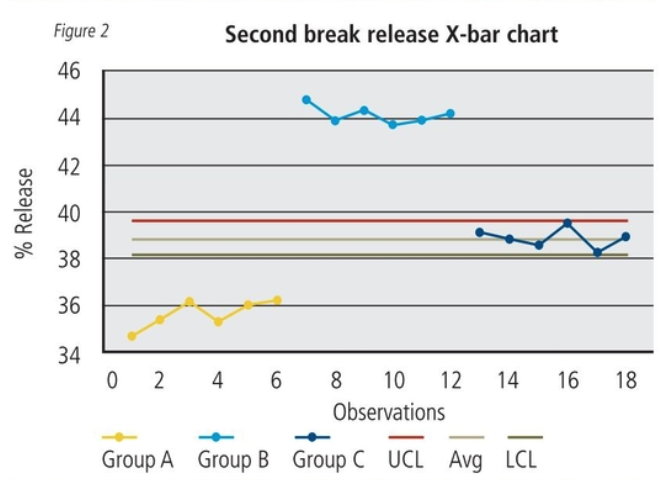
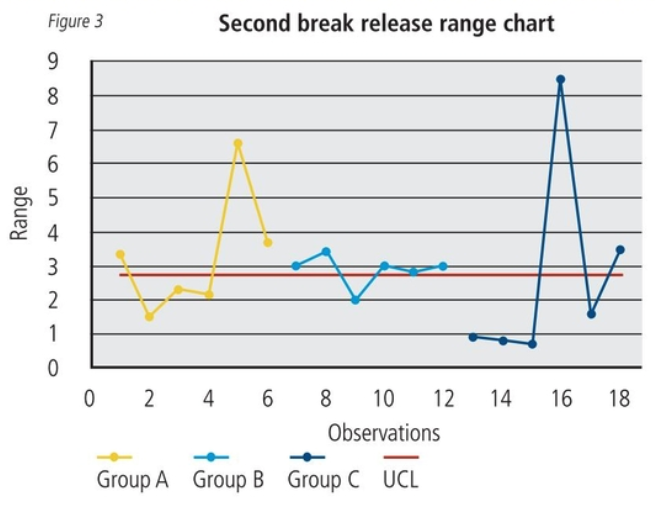
Group D data was used to develop a control chart with group size N=5 and both the X-Bar or average and Range were determined to be in control and suitable for setting break release parameters .
Figures 2 and 3 shows the X-Bar and Range chart performance for groups A, B, and C based on group D performance. Training makes a difference!
Conclusion
Measurement of grinding operation performance, whether in the break system B, reduction system R and/or D, is a useful tool in maintaining mill balance. It must be a well thought out method and procedure followed strictly by all operators on every shift to have value. Review what is being asked of your operators, document and streamline procedures where appropriate and train them well to ensure consistent uniform testing is being conducted. Let controlled uniform grinding help bring your mill in balance.