Flour color is an important consideration in wheat and flour quality assessment. In the production environment, flour streams and grades are frequently examined visually using a flour slick and a Pekar test. Visual examination is subjective in nature and influenced by the lighting available in the mill as well as personal perception. Laboratory equipment using sophisticated technologies and following exacting procedures is often employed to reduce subjectivity and provide definitive and repeatable measures of flour color.
Many wheat crop reports utilize these instruments to measure and report flour color, an important quality measure for millers and their customers. Tristimulus color measure of flour is a numerical system to measure a sample’s lightness (L*) on a scale of 0 to 100 and “chromaticity,” or hue, on two scales each running from -60 to +60 for green-red (a*) and blue-yellow (b*). High L* values indicate a bright color, and higher b* values indicate more yellow. Flour color is influenced by the wheat’s endosperm color, particle size and flour ash content often affecting the color of the finished product.
Flour particle size is an important factor in both the perception and measurement of flour color. In some flow sheets, two flours may be separated using two different sets of flour cloth in series. The two flour streams generated may have remarkably similar ash contents but appear quite different in terms of color observed or measured. For example, the first or top flour separated Coarse Sizings (R1) Fine Sizings (R2,) 1 Middlings (C1) and 2 Middlings (C2) had ash contents of 0.36%, 0.33%, 0.29% and 0.29%, respectively. The second or bottom flour separated had ash contents of .033%, 0.33%, 0.28% and 0.30%, respectively. Most often the first or top flour removed is finer and whiter than the second flour removed, which is coarser and appears darker both visually and when measured using various color measurement instruments.
Flour color visual assessment and measurement is challenging because of particle size. When light strikes the surface of an exceptionally fine particle mass giving the appearance of a smooth sample surface it is reflected to the source, detector or observer. Increased light reflected from sample is perceived and measured, indicating a lighter color appearance. As the particle size increases the surface is more rough, resulting in more light being reflected off in different directions other than the source, observer or detector.
Decreased light reflected from the sample is perceived and measured indicating a darker color appearance. Technically the diffusion of light also may include to some degree the absorption of light energy as one might observe wearing a dark shirt in the bright sun and finding out it gets more warm than a light shirt reflecting light.
Flour particle size may contribute to diffusion while darker bran particles may contribute to absorption. The academic differentiation, while technically important, is of little interest to this author. In this article, light not reflected back to the source, observer or detector will be considered. Absorption is calculated by subtracting Spectral Reflectance % from 100%.
Wheat endosperm other than from durum wheat is generally white in color compared to bran and the pigment strand found in the wheat kernel crease. Increased bran content in flour streams or grades results in a darker flour, which often is less desired by the customer. In some countries flour color is a more important consideration of quality than flour ash content. In other areas of the world, ash content rather than color is a driving quality factor. The ash content of pure endosperm varies due to variety, class and production environment variations falling in a range of 0.18% to 0.22%, while the ash content of bran is in the range of 6.5% to 7.5%. Flour color and ash are both important quality parameters and are of interest to millers and their customers.
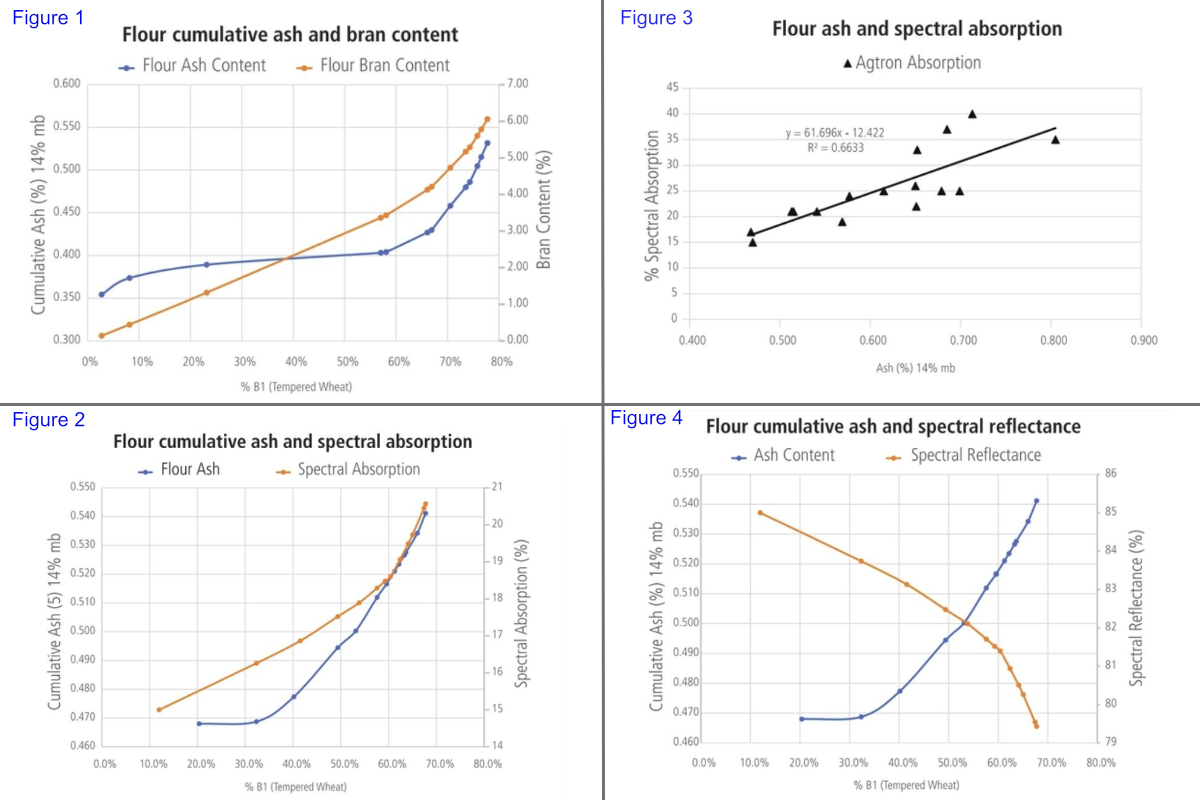
Figure 1 shows the relationship between the cumulative ash content and cumulative level of bran contamination in flour. The flour was produced using a Bühler Tandem Mill using hard red winter wheat tempered to 16% moisture content for 24 hours prior to milling. The estimated bran content of the flour was based on the ash content of pure endosperm and bran at 0.20% and 7% ash content, respectively. Increasing cumulative ash content reflects increasing percentage of bran contamination in the flour. The data represented are based on a single observation. It is likely that additional replications and actual ash contents of pure endosperm and bran ash content from the sample milled would improve curve similarities.
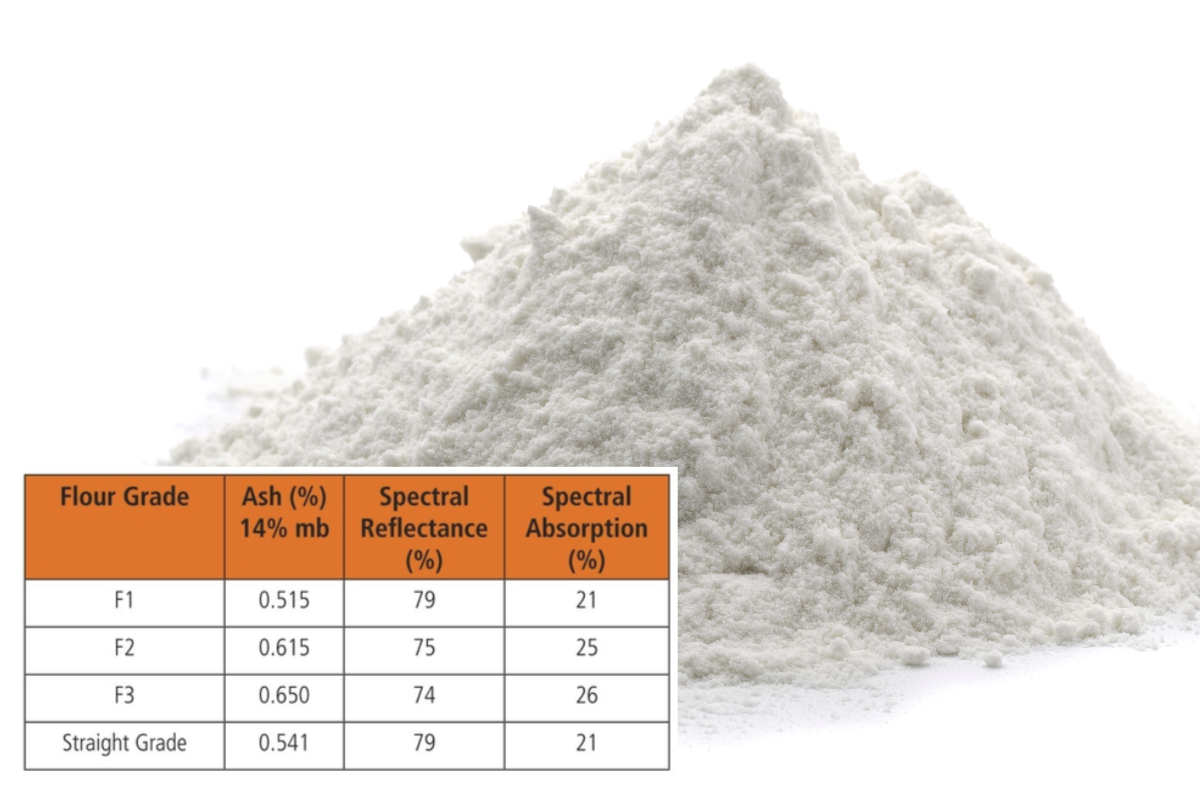
Figures 2-4 are based on flour produced in the early 2000s using 16% moisture hard red winter wheat tempered for 24 hours prior to milling. The tempered wheat was milled using a batch walking flow sheet procedure. Flour color was measured in dry flour samples using an Agtron M-45 Color Meter (Agtron Inc. Reno, Nevada, US).
The Agtron M-45 color meter is a direct-reading reflectance spectrophotometer designed to measure the relative spectral qualities of product samples. The machine, set on the green wave length (546 nm), is calibrated using a 67 calibration tile for the “0% Relative Spectral Reflectance” reading and a 97 calibration tile for the “100% Relative Spectral Reflectance” reading. When using the green wavelength light, relative spectral reflectance is inversely proportional to the degree of bran contamination in the sample. The higher the relative spectral reflectance the brighter (better, lower ash) the flour. Flour ash content was measured using a commercial NIR unit without benefit of stream specific calibration data and robust ash calibration, which NIR instrument manufacturers have since dramatically improved.
Figure 2 compares the NIR ash content and absorption of the various flour streams from the milling process. Spectral absorption was calculated by subtracting the reflectance from 100. There appears to be a reasonable relationship between flour ash content and spectral absorption. With multiple experiment or test replications combined with utilizing improved NIR calibrations or furnace ash measurement the R2 value would likely improve. The figure supports the generally well-known principle that darker flour contains more bran particles. The gradual reduction system of wheat flour milling has an opportunity for improvement.
The relationship between flour cumulative ash and spectral reflectance is shown in Figure 3. As the cumulative ash increases the spectral reflectance decreases. Increased bran level confirmed by increased ash content results in darker flour indicated by lower spectral reflectance. The cumulative ash curve and cumulative spectral reflectance curves are nearly the inverse of each other.
As the cumulative ash content increases the spectral absorption increases and the resulting curves are similar as shown in Figure 4. Recall from earlier that Spectral Absorption was calculated by subtracting Spectral Reflectance from 100.
In making observations regarding flour streams and flour grade color it is important to keep in mind the limitations of the observation and measurement made. Changes in observations should be explored carefully before being dismissed. Is the difference in color related to endosperm ash content, bran ash content, bran ash, particle size, sample preparation for instrument measurement light source changes or human error? Who knows? Some of those changes may relate back to process operation management such as roll adjustments, unplanned or inadvertent sifter cloth changes. Pick your tools and use them wisely.
Jeff Gwirtz, a milling industry consultant, is president of JAG Services Inc. He may be reached at [email protected].