KANSAS CITY, MISSOURI, US — The following are quotes from a statement “Milling – A Profession” in a 1945 Association of Operative Millers (AOM)Technical Bulletin:
“Each year, each month, almost each day the material the miller uses will have its variation. In handling this efficiently, how important is ‘the human factor’ — that ‘individual touch’ of the competent miller. We observed mills (that are) splendidly constructed and filled with the most efficient equipment. But the milling engineer wants his mill to be operated by a miller whose ‘touch’ he knows, and who will bring individual ideas and personal thought to bear upon its problems as they rise.”
The above statement holds true today, even with the significant developments in mill construction and technology since the middle of the 20th century. The hands-on adjustment of the system by the miller is still needed to optimize results even with the latest developments in equipment construction, electronics, automation, wheat, and end products analysis.
Mill systems also differ in their flowsheet, and multiple variations in equipment characteristics such as roll corrugations, sieves, and air systems, just to mention a few. The following are two suggested methods that give the miller advanced tools to analyze and optimize results from a given milling system. The methods were applied successfully in numerous commercial flour mills, of different vintage, around the world. The methods are based on testing, analysis, and creating objective adjustment targets. They could be useful in facing continuous fluctuations in the raw materials, environment changes, and requirements to supply customers with uniform products.
To overcome the above variation in the mill, the professional miller is continuously challenged by the need to optimize yield and quality. Liu et. al. (1992), showed that besides wheat cost and production cost, flour extraction is the main contribution to the Internal Rate of Return (IRR) of the milling operation.
Mill analysis
Mill analysis is an issue that should be performed systematically for each milling unit. Farrell and Ward (1965) and Posner and Hibbs (2005) suggested the use of the Distribution Table (DT) method to analyze a flow sheet and the stock in an operational mill. It is one of the most useful tools in examining your mill flow.
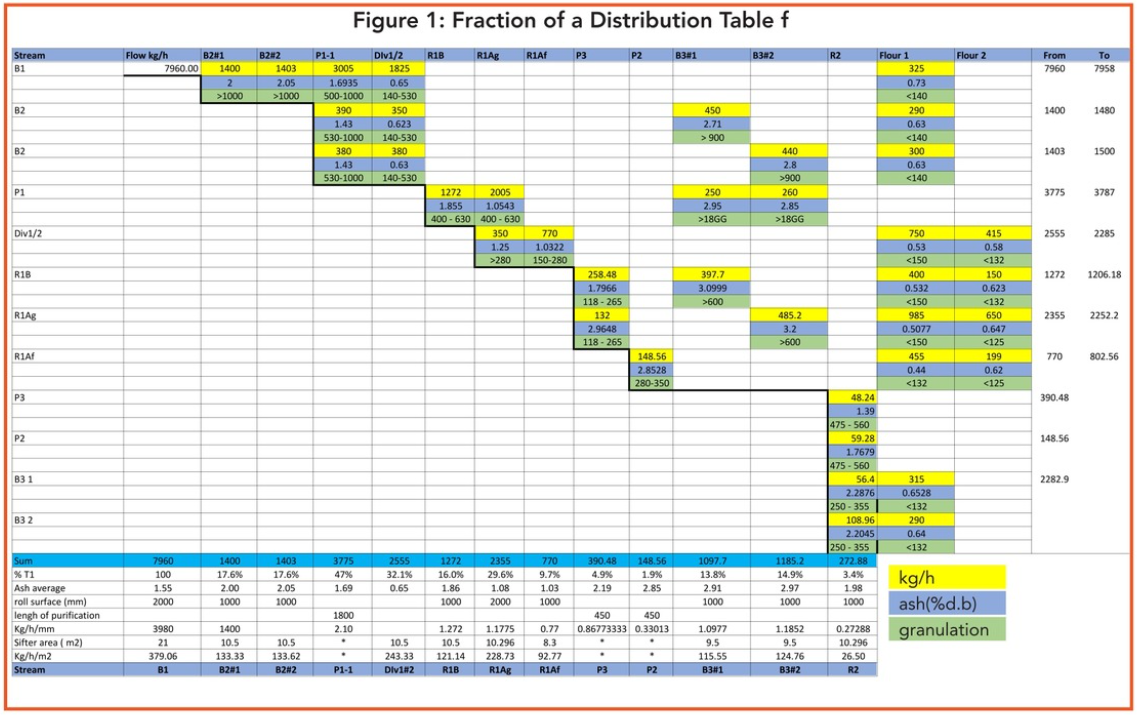
Gwirtz (2019) described the procedures for setting up a DT for an existing or planned flow sheet using a Microsoft Excel spreadsheet. In Figure 1, the sequence list of stages on the left and on the top are the same, and when noting flow of one stock from one stage to the next, a stepwise line is created.
In the final optimized DT, the filters stages should be positioned at the end of the DT. Materials to the filters from the purifiers should include just small bran particles. Materials from the pneumatic system to the filters, if optimally adjusted, should include only flour dust, which is high in protein content.
The initial marking of stocks can give an indication if ring-around exists in the flow sheet and if some material is located on the left side of the stepwise. It must be avoided to prevent negatively affecting the flour quality as well as impacting the mill balance and therefore creating unwanted clogging.
To collect the samples of the stocks under the sifter sections, the miller starts at the end of the stepwise line and keeps sampling back to the first break, section by section. In the DT, each of the stocks collected, weighed, and corrected to kilograms per hour should be marked in the appropriate cell of the Excel spreadsheet. The sum of material from each stock should be approximately the amount of product sent to this stock. This indicates accuracy in the sample collection process.
Each stock should be checked for ash and corrected to dry, or certain moisture basis. Each cell should also show the granulation range of the stock by indicating the aperture of the sieve through which it went through, and on which it was over tailed.
Information about the materials’ granulation helps the miller in the process of sieves aperture adjustments. Wingfield (1974) pointed out that some changes in the mill, in relation to ash and flow, require a depth understanding and a closer look at things that are creating these deviations. With this perspective in mind, we suggested that at the bottom of the DT a table must be added in order to describe a summary of the main information obtained in each of the DT columns, such as percentage of material based on B1.
In the optimal DT, there’s a gradual decline in the total product flowing to each stage in a group (group of stages, namely breaks, reductions and middlings), and a gradual increase in cumulative ash (in stages in the above groups) toward the right end of the table. The arrangement of stocks in the DT should be used also for the lay-out table of all mill materials. This will allow evaluation of quality characteristics of the different materials flowing to each stage in the milling system.
Break release optimization
Break Release Optimization is an issue already discussed by professional millers as expressed by Jackson (1944). To a large degree the adjustment of rolls is a subjective process based on feel and sight of the professional miller. Gwirtz (2002) showed the variability effect of human sampling on results. Today, there are different ways and ranges of suggestions regarding suggested break release adjustments used by mills around the world.
Peterson (1949) stated that the release of the first three breaks in the mill could give a good indication about the expected total flour yield, as the stocks from the first three breaks are distributed one way or another throughout the whole system. The current suggested method of optimization determination of a break release factor that is a calculated number based on the ratio of cumulative releases materials in the first three breaks and their cumulative ash values.
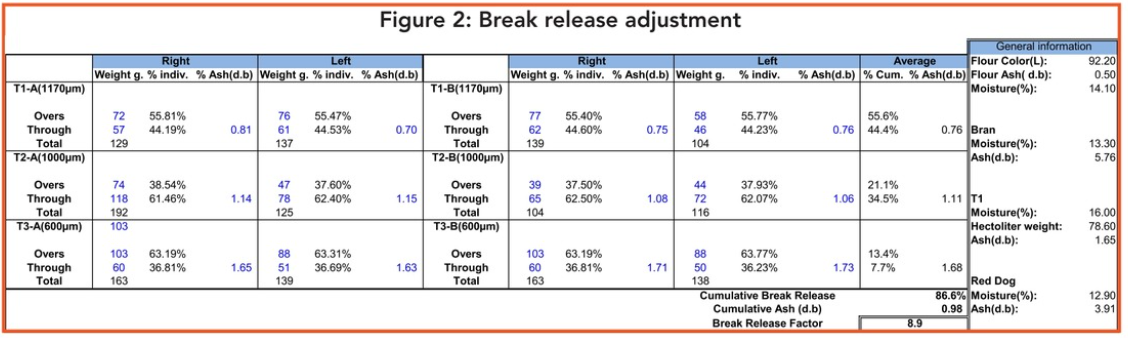
Figure 2 shows an Excel spreadsheet of a commercial mill break release factor (8.9). The higher the factor, the better the release settings. Data shown in the sample table in Figure 2 should be copied to an Excel spreadsheet to set up the data insertion and required calculations for the commercial mill. The collection of the material below the roller mill must be carried out with product on the right and left sides separately.
After sieving, the break release adjustment should be a maximum of 1 percentage point different for each material sieved. The sieve aperture used for the laboratory sifter should be the one closest to the opening of the industrial plansifter compartment. This sieved material must be checked for ash content (in this case on a dry basis, or on moisture basis that is defined as standard). The break release factor would be a subjective target for each milling unit, as usually determined by the head miller when defining the best adjustment for a particular wheat or wheat mix.
It is suggested that the information related to wheat characteristics and the final product’s qualities also be added to the Excel table.
Conclusion
Utilizing an analysis method of a wheat milling system by the usage of the distribution table can be beneficial to millers. Using an Excel spreadsheet provides most of the milling technology information of a milling system to the operative miller to make decisions.
The other issue experienced in optimization in adjusting multiple commercial mills is the concept of “Break Release Factor.” This approach allows the operative miller to follow and target the best adjustment for the first three breaks based on qualitative and quantitative aspects of the process.
Ricardo Lopes has MSc in Food Science and Technology at the State University of Ponta Grossa and is a graduate of the Swiss Milling School. He may be reached at [email protected].