In my previous article, “Assessing Milling Potential,” in the September 2019 issue of World Grain, the purpose and use of laboratory milling to assist in evaluating potential milling performance of wheat in commercial milling was presented, as was the importance of controlled laboratory milling following specific procedures. Additionally, differences between alternative laboratory milling equipment were identified.
The second part of this two-part series will present results of varying Bühler Tandem mill settings on the same wheat and impact on mill balance and flour analysis.
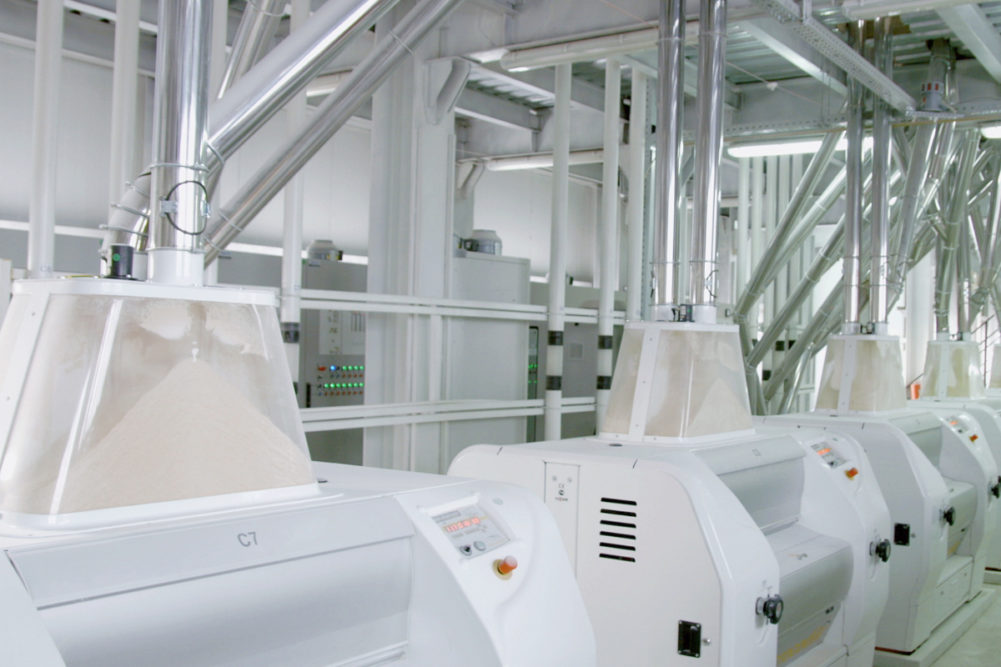
AACC Approved Methods of Analysis by the Cereals and Grains Association does not include a standard procedure for the Bühler Tandem mill. For this exploratory study, 4-kilogram control samples of Hard Red Winter consisting of equal parts of the varieties Everest and 1863 were tempered to 16% moisture for 24 hours prior to milling at 400 grams per minute on the Bühler Tandem mill. The mill was run empty for 45 minutes prior to milling with room conditions held at 22 to 23 degrees C at 60% to 66% relative humidity. Target yields were 60%, 65%, 70%, 75% and 80% based on wheat to the mill and three samples were milled at each setting.
Flow diagram

The flow sheet for the Bühler Tandem Mill is based on the work of David G. Martin and James Dexter, entitled: “A Tandem Bühler Laboratory Mill: Its Development and Versatility,” from the April 1991 Association of Operative Millers Technical Bulletin. The mill consists of five breaks, a sizings grinding and six reductions. The breaks and sizings grinding are processed on one unit with B1-3 accomplished on one roll pair and R1, B4 and B5 milled on the second roll pair of the unit.
Reduction grinding is accomplished on a second connected unit with C1-3 ground on the first roll pair and C4-6 on the second roll pair of the unit. Break bran and shorts taken as one stream is combined with reduction shorts separated at C4 and C5 and passed twice through a laboratory duster. The fine material is collected and sieved on a 118 μm screen for two minutes to remove Bran and Shorts Duster Flour. Filter stock from both the break and reduction units are combined with Pollard (Red Dog) and sifted for two minutes on a 118 μm screen with the resulting flour identified as C6 flour. The filter stock from the break unit has a typical gray-steel color like poor suction flour while the filter stock from the reduction unit is whiter like good suction flour.
The cumulative ash curves for the five different settings of the Bühler Tandem Mill.
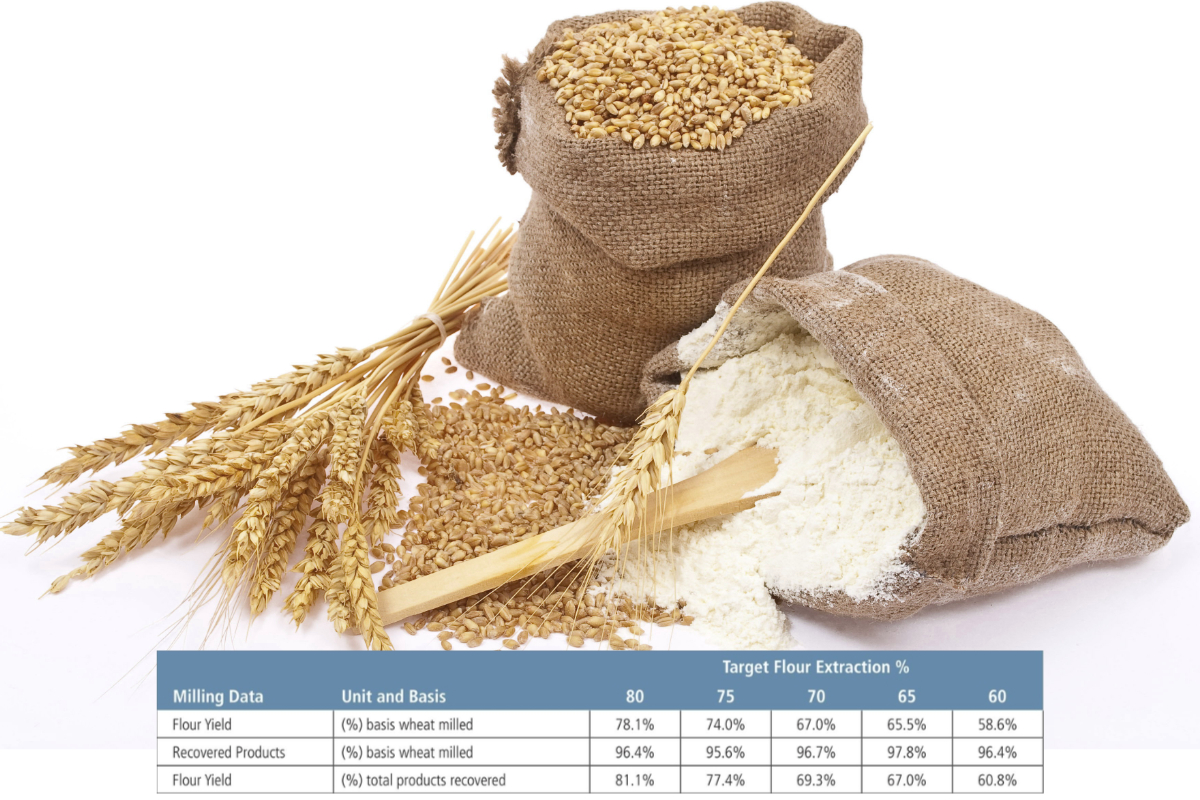
Figure 1 shows yield values that include both yield basis wheat to B1 and total products recovered. Flour ash used in development is on a 14% moisture basis using the Hard Flour Calibration of the Foss NIRS DS2500 with a small sample cup.
Low yield and ash levels were achieved.by opening from the standard setting the second roll pair, which includes R1, 4B and 5B, leaving endosperm on the bran and reducing grinding of bran and ash containing fractions. Intermediate yield and ash levels were accomplished by closing in on the second break roll pair like the units standard setting.
The higher yield and ash levels were accomplished by tightening both the second roll pair in addition to the last roll pair, which includes C4, C5, and C6. These changes reflect the type of changes that might be observed by a laboratory technician with limited understanding of mill operational objectives.
Milling yield, recovery percentage

Milling yields and the recovery percentage are shown in Figure II while analytical results are provided in Figure III on that page. As would be expected, the flour ash and protein level of straight grade flour increases with flour extraction. Changes in flour properties, dough rheology and baking results demonstrate changes in performance based on milling methods and flour yield.
When evaluating wheat crop quality and relating to commercial performance, it is very clear that the laboratory milling method employed must be constantly uniform in practice.
How well can laboratory mill results reflect wheat purchased or your mill performance if the laboratory milling process uniformly set under consistent conditions of operation? Perhaps looking into laboratory milling procedures and setup will improve laboratory mill utility in operation management and quality control.
In the next article, we will investigate the relationship between various flour quality testing methods based on these samples.


