WASHINGTON, D.C., U.S. — The U.S. Department of Agriculture (USDA) in its annual Acreage report on June 28 estimated 2019 corn planted area at 91,700,000 acres, up 2.9% from 2018, down 1.2% from the March Prospective Plantings forecast and well above trade expectations that averaged about 87 million acres.
Corn futures tumbled after the release of the USDA report, which surprised traders expecting a much lower planted area estimate due to planting delays and prevented plant acres because of excessive spring moisture.
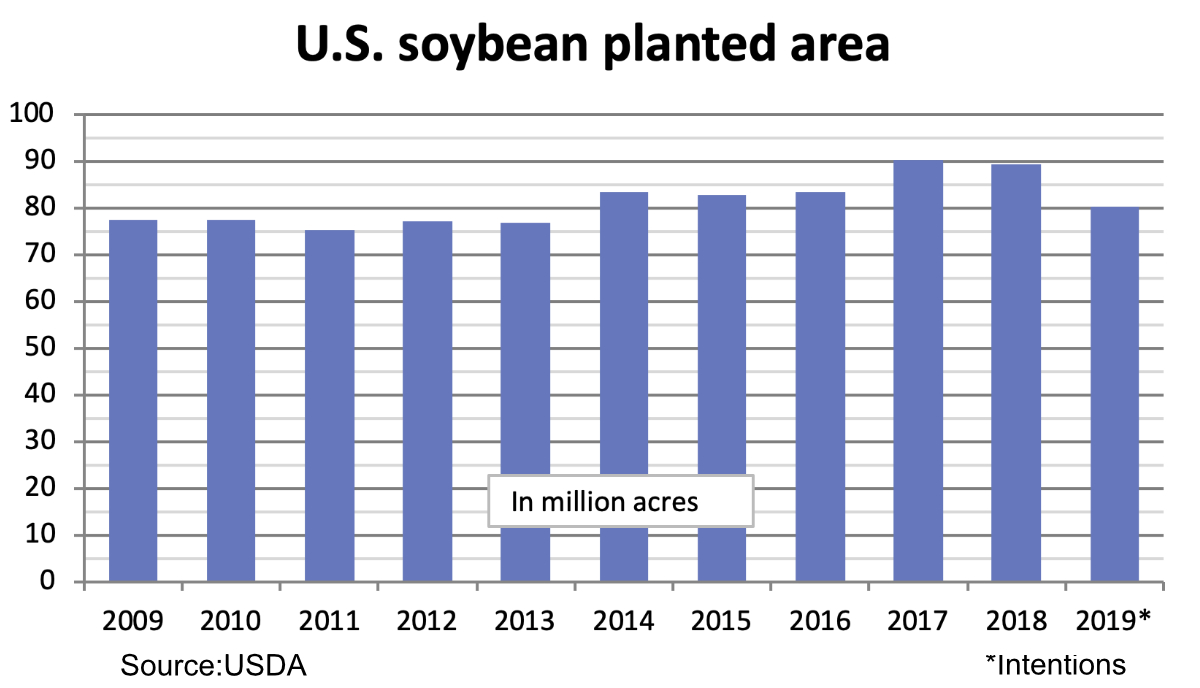
Soybean planted area was estimated at 80,040,000 acres, down 10% from 2018, down 5% from March intentions and the lowest since 2013 if realized.
Soybean futures moved modestly higher after the report, with the USDA estimate well below the trade average of about 84.5 million acres but gains limited by sharply lower corn futures.
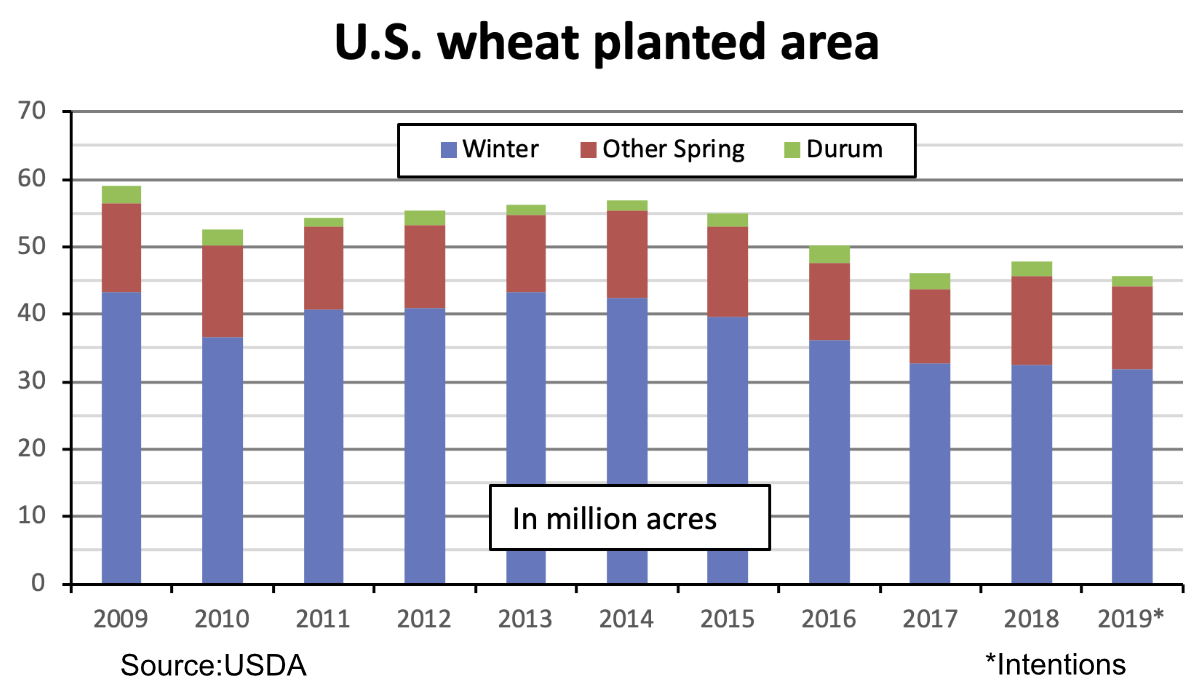
All wheat area planted for harvest in 2019 was estimated at 45,609,000 acres, down 4.6% from 2018, down 0.3% from March intentions and the lowest in records back to 1919.
Winter wheat planted area was estimated at 31,778,000 acres, up 1% from the latest estimate but down 2% from 2018 (including hard red winter at 22.7 million and soft red winter at 5.54 million), durum at 1,401,000 acres, down 32%, and other spring wheat at 12,430,000 acres, down 6% (including hard red spring at 12 million).
The USDA estimates were below the average of trade expectations for all wheat, durum and other spring wheat but were above the trade’s winter wheat average estimate. Wheat futures traded sharply lower after the report with spillover pressure from corn.
The USDA, in its June 28 Grain Stocks report, estimated old crop all wheat stocks on June 1 at 1.072 billion bus, down 2.5% from June 1, 2018, including 207 million bushels on farms, up 58%, and 865 million bushels off farms, down 11%. Durum stocks were 55.2 million bushels, up 58%. June 1 wheat stocks comprise the 2019 carryover.
Corn stocks in all positions on June 1 were estimated at 5.202 billion bushels, down 1.9% from a year earlier, including 2.950 billion bushels on farms, up 7%, and 2.253 billion bushels off farms, down 12%.
June 1 soybean stocks were estimated at 1.790 billion bushels, up 47% from last year, with on-farm stocks at 730 million bushels, up 94%, and off-farm stocks at 1.060 million bushels, up 26%.
The USDA. corn, soybean and wheat stocks estimates all were below the average of trade expectations.