In my previous article in the February 2019 issue of World Grain, the procedure to develop utilizing step charts was presented as part of a series of articles to discuss in greater detail the development and utilization of the three tools mentioned in Mark Fowler’s article, “Balancing the mill,” in the February 2012 issue of World Grain.
As previously indicated, the analysis of all mill streams identified in a commercial mill step chart is seldom conducted due to time and resource constraints. More often, a weigh off and analysis of only the flour streams is conducted to develop a cumulative ash curve. This article is intended to provide a brief introduction to cumulative ash curve development.
John Wingfield, in the “Dictionary of Milling Terms” published by the International Association of Operative Millers in 1989, defines a cumulative ash curve as “a graph showing how flour ash increases when starting from the lowest ash individual flour in a mill and progressively adding the rest of the individual flours to previous mix in order of their ascending ash contents.” It is a tool for evaluating mill performance and varietal and crop year differences of wheat that effect milling.
Data collection for the cumulative ash curve must be conducted to ensure an accurate weight is recorded and calculations made to a common time basis such as kilograms or metric tons per minute or hour. Samples collected for ash and other analysis must be collected with care to reflect current production rather than old stock remaining in the weigh off spout or contamination with other materials in the mill.
Following data collection as described in a previous article in this series is advised.
Checking the Data
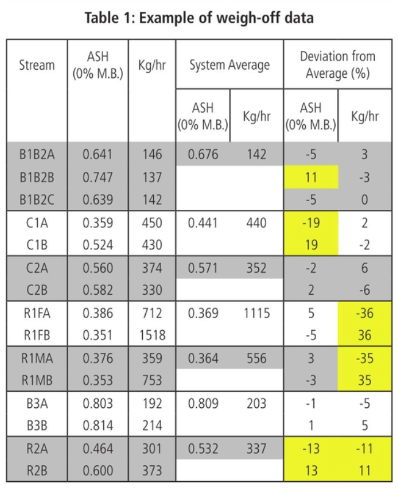
The data collected should be carefully examined to check for errors in measurement and balance from both a quantitative and qualitative perspective. Table I provides an example of a portion of a flour weigh-off analysis.
As a guideline difference in either the quantity or quality measurement of 5% to 10% should be examined. In the case of B1B2 stock sieved on three sections of sifter A, B and C, the difference in ash content from section B is suspect and should be re-tested or re-sampled. Perhaps it is different due to screen wear, screen selection or a hole in the screen. The difference must be further explored.
Likewise, the ash content of C1 flour produced on two different sections at the same rate appear quite different and must be examined. C2 flour is reasonably close in terms of both production rate and ash content, suggesting balance in load, grinding and sifting.
R1F flour production rate is quite a bit different between the two sections employed, indicating a difference in loading, grinding or sifting that must be explored. B3 like C2 demonstrates similar performance level in terms of flour production and grinding for multiple sifter sections.
R2 flour production rate and quality are significantly different and must be examined closely. In these examples, one might look at the load and granulation of incoming stock to the sifter sections. Both the quantity and granulation should be similar, otherwise further examination into grinding and roll input is warranted. If the quantity and quality of the stock to each section is similar, the sieve sections must be examined to confirm proper flow, cloth selection, cloth wear and cleaner performance.
Excessive variation in flour production rate and ash should be taken as sign of imbalance and corrected immediately.
Calculations
Moisture content of the flour produced is used to adjust ash content to a common moisture basis. In North America, it is common to adjust ash to a 14% moisture basis while internationally a 0% moisture basis is commonly used.
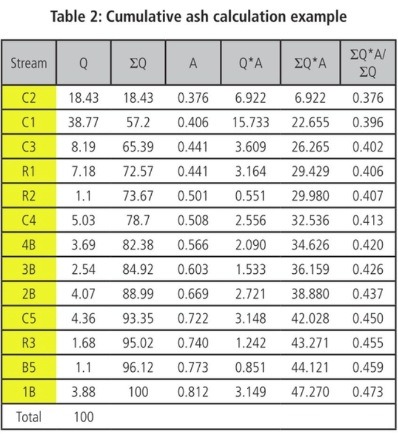
The stock name and quantity (Q) of flour produced per unit of time along with its adjusted ash content (A) (0% moisture basis in this example) are then sorted from the lowest ash content to the highest ash content as shown in Table 2.
The quantity (Q) can be the weight per unit time or a percentage based on wheat to B1 or total flour weight as desired. A column to the right (Q) is used to calculate the cumulative quantity contribution of each successive flour contribution (ΣQ). The weight of the first flour is added to the weight of the second for the cumulative quantity of the first two flours. The combined quantity of the first two flours is added to the quantity of the third flour to calculate the quantity of the first three flours. This process is repeated until the last flour has been added. If correctly calculated, the cumulative quantity after the last stream is added is the same as the summed quantity of the individual streams.
A column positioned to the right of the flour’s adjusted ash content (A) is added to calculate the stream’s contribution of ash by multiplying the stream quantity (Q) times the adjusted ash content (A) shown as (Q*A) contribution of an individual stream to the total flour ash content.
An additional column is used to calculate the cumulative quantity of ash (ΣQ*A) in the flour produced using the same algorithm as described for calculation of (ΣQ). Finally, for each successive stream the cumulative ash is calculated (ΣQ*A)/ (ΣQ). The value calculated in this step is the cumulative flour ash content of the previous streams up to and including that stream.
The Graph
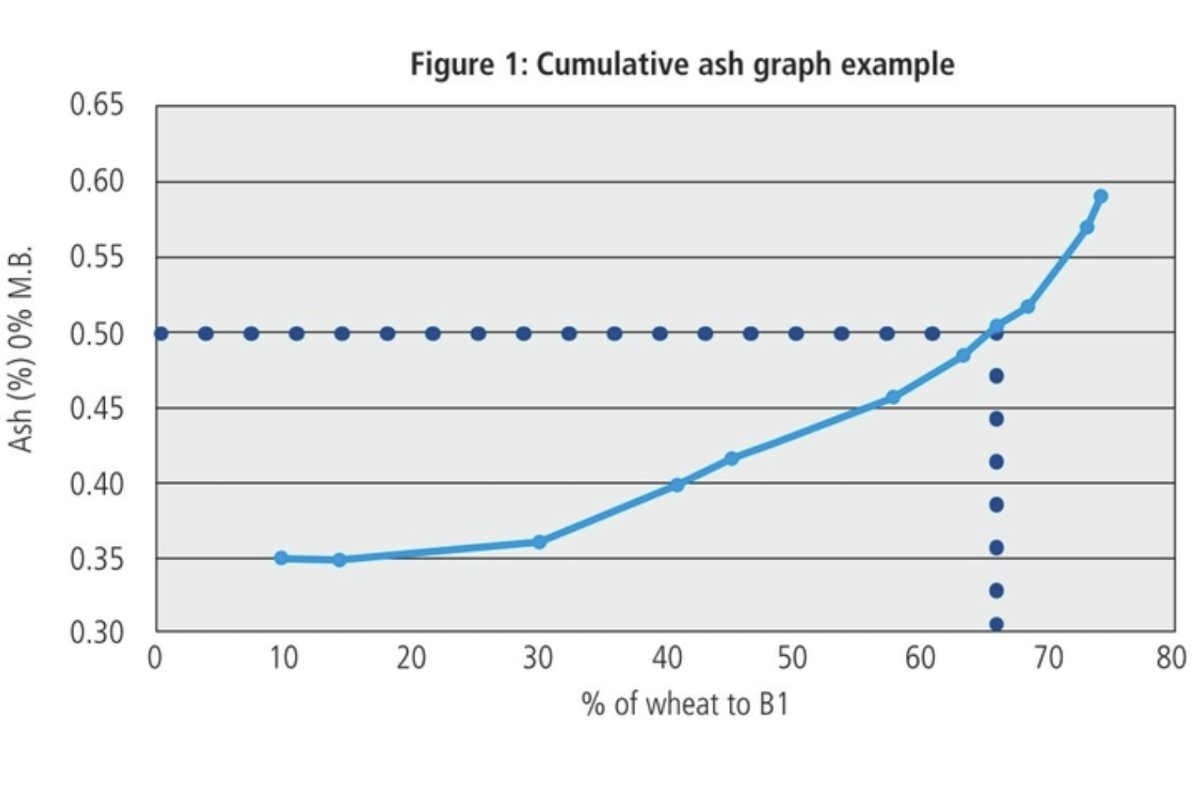
The data to be plotted from the calculations like those shown in Table 2 are the cumulative quantity (ΣQ) on the “X” or horizontal axis and its corresponding cumulative ash (ΣQ*A)/ (ΣQ) on the “Y” or vertical axis as shown in Figure 1. Figure 1 shows a cumulative ash curve for a mill made during the start-up process. When plotting, it is important to plot using a scatter plot rather than categorical data plot in order to facilitate accurate interpretation.
Interpretation
The resulting curve can be used to determine what the ash content of a combined flour will be at any selected flour percentage, or what percentage of flour can be obtained to a given ash specification.
For example, in Figure 1, to estimate the percent of flour meeting a 0.500% ash content, a horizontal dotted line drawn from vertical axis at 0.500% ash intersects the cumulative ash curve.
At the intersection of the cumulative ash curve, a vertical line is drawn straight down to the horizontal axis. Where the vertical line intersects the horizontal axis, it is estimated that approximately 66% of tempered wheat to B1 is recovered with an ash content of 0.500%.
The ash content of the remaining flour also can be estimated mathematically by solving for A2 in the following two-part blending problem. The total percent flour based on first break is 76.4% with an ash content of 0.594%, and it is composed of Part I at 66% flour with an ash content of 0.500% and Part 2 flour at 6.4% of wheat to first break with an unknown ash content of A2 as shown below.
Total Ash = Part 1 Ash Contribution + Part 2 Ash Contribution
Qt*At = Q1*A1 +Q2*A2
(74.2 * 0.594) = (66 * 0.500) + ((74.2 - 66) *A2)
A2 = 1.561 % ash on 0% Moisture Basis or 1.561*(86/100) = 1.342 % on a 14% Moisture Basis
Conclusion
Development of a cumulative ash curve provides a useful fingerprint for both wheat and mill performance. Conditions of sample collection and calculations must be carefully managed and scrutinized to uncover issues of mill balance and accuracy.
The quantity and quality of flour generated at the numerous production locations is an important tool from both a technical and economic standpoint. How well known is the quality and quality of flour generated in your mill and does it reflect a properly balanced and managed mill?


