In my previous article in the November 2018 issue of World Grain, the procedure to develop and analyze granulation curves was presented as part of a series of articles to discuss in greater detail the development and utilization of the three tools mentioned in Mark Fowler’s article, “Balancing the mill,” in the February 2012 issue of World Grain.
John Wingfield, in the “Dictionary of Milling Terms” published by the International Association of Operative Millers in 1989, defines mill balance as “the proper distribution of stock to the various parts of the milling system, as determined by the flow sheet, to ensure proper loading of equipment and high milling efficiencies.”
Wingfield suggests that the distribution or balance of the ground stock must be kept within the parameters of the system design to maximize mill performance as part of the balancing act measures. The development of a step chart for a mill is a valuable exercise in developing an understanding of both the mill flow sheet and balance. A weigh off and analysis of all mill streams identified in a commercial mill step chart is seldom conducted due to time and resource constraints. More often, a weigh-off and analysis of only the flour streams is conducted to develop a cumulative ash curve.
Step chart development
A step chart is a method of tabulating the flow rate, percentage of total stock, and the quality of stock going to (destination) and from (origin) each operation in a mill flow for the purpose of analyzing load and quality balance throughout the entire mill.
Before rates can be measured and percentages calculated, the source and destination of product streams must be properly identified. This identification step alone can provide a better understanding of mill flow and balance for the new mill operator. In simplest terms, it lets the operator know what downstream systems are impacted by a process. Properly developed, the step chart provides the sequence to be followed for a weigh-off and sampling to ensure product flow rates and qualities are measured without having been disturbed or put out of balance by previous disruptions of material flow or machine performance. Flow rate measurement and samples should be taken from the end of the mill forward or from the lower left toward the upper right of the step chart.
Coupled with granulation profile data and sifting efficiency, the step chart can be used to estimate loads in the mill. Such an estimate could be useful in large mills where measurements might be difficult or inaccurate due to the large flow rate, number of locations to be sampled, weighing and timing errors. Extremely light or heavy mill loads might call into question the need or value of a designed separation when coupled with product quality information such as granulation, density and ash. Product rates and quality can be used to evaluate and understand equipment utilization, especially roll, sifter and purifier surface. In addition, the load information and quality information collected is useful in identifying material handling requirements for either bucket elevators or pneumatic conveying systems.
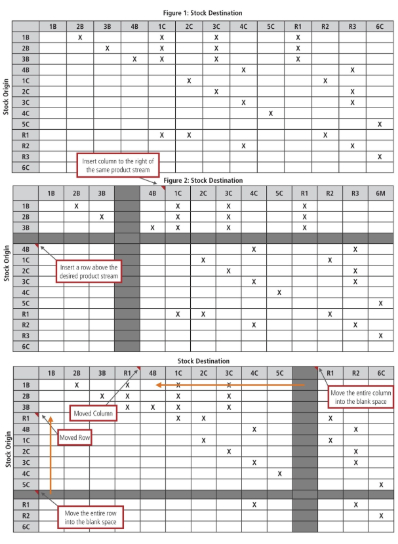
A process for generating a step chart using Excel is provided as an alternative method to using graph paper. The step chart begins with a vertical list of all process system names along the left-hand side of the sheet representing the stock’s origin. A horizontal column of the same systems names in identical order is to be placed above the vertical column using the Copy, Paste Special, Transpose function. Identify the destination of stock from each origin by placing an “X” in the appropriate column indicating that stock flows from B1 to B2, 1C, 3C, and R1 as shown in Figure 1.
To make the system names occupy less column width, simply highlight the cells at the top of the columns and use Format, Cells, Alignment and set the alignment to 90 degrees. Adjust column width (use Format, Column, Width) to the least amount of width necessary for the data you wish to include in the cell for example, an “X” to indicate destination, load or rate, moisture, ash, protein etc. as desired. The spread sheet allows the possibility for evaluating alternative sequences.
Figure 2 shows the insertion of an empty row above the 4B row and an empty column to the left of the 4B column. However many rows are added above a certain origin, the same number of columns must be added to the left of the same destination stream. In this case, there is but one row and column being inserted. The content of the selected row or rows is moved into the empty row while a corresponding move is made for the selected column. In the case shown in Figure 1, the R1 was moved into the empty row/column. Moving the entire row and column, move the “X’s” associated with the stream’s origin and destination. After the move is completed, the newly created blank rows and columns are deleted and the process of identifying additional moves to ensure all destinations stocks are shown below origin stocks as required in the definition.
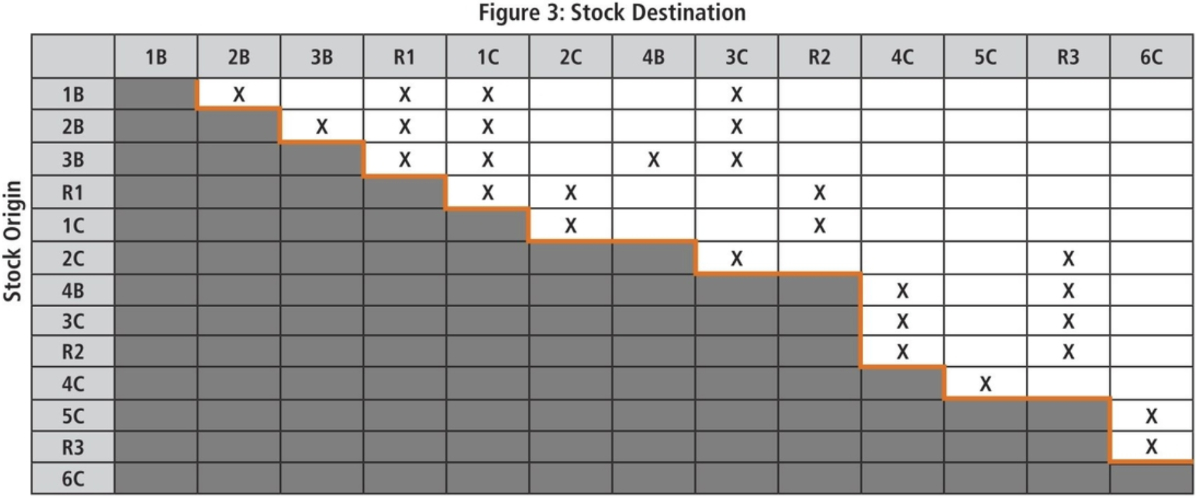
If the chart has been properly sequenced, all flow points to be measured will be to the right of a diagonal line drawn from the upper left-hand corner of the chart to the lower right-hand corner. These lines can be drawn in Excel using the following command sequence; Format, Cell, Boarder, after which the desired line style may be selected and applied to the appropriate side(s) of the cell or cell range selected. The line starts with the first product stream in the first row to the left drops down until it passes the next product stream in the column then moves across the row until the next product stream is encountered. The process is repeated from the top left of the chart to the bottom right, resulting in a chart as shown in Figure 3.
Sometimes it will be impossible to establish a diagonal, stair-stepped line across the page moving from the upper left-hand corner to the lower right-hand corner. In such cases a ring-around in which product from a system finds its way back into the same system directly or through another system. A ring-around is best avoided but may be needed in order to maintain equipment functionality of balance as in the case of purifier systems in some durum mills. Without some “re-cycling,” it might otherwise be impossible to set the purifier properly to clean up the product stream.
When properly managed, the net effect of any ring-around must be zero. In engineering terms there must be mass balance, what goes into a machine or process must equal what comes out of a machine or process.
The result of ring-around mass imbalance is fully appreciated and understood by most floor sweepers, utility persons and mill operators, and can be mathematically described by engineers using differential calculus. However described or understood, the result of imbalance is poor quality, poor machine function and productivity and product on the floor. At the very least, identification of these ring-around points is useful in the troubleshooting process.
Collecting the data
During the period of a weigh-off, the mill must be operating in a steady state with a uniformly conditioned homogeneous wheat grist. Great care should be taken to confirm automated control systems that start/stop or increase/decrease flow rates are not frequent or excessive, as such changes may manifest flow rate and stock quality.
When collecting data for a complete or partial weigh-off, it is essential that the weigh-off and sample collection is taken beginning downstream and move upstream to the beginning of the system of interest. The one exception to this is flour stream collection, which may be conducted in any order as the flour is leaving the milling system and its collection will not alter milling streams.
Collection containers must be adequate to hold the weigh-off sample to be taken for the largest reasonable time period as possible – at least 15 seconds for high flow rate streams and longer to collect amount of material for testing purposes (moisture, ash, protein, granulation, density etc.) The units of mass and time must be properly recorded for weight of material collected to be converted to a uniform time period for example Kg/min or Kg/hr. Prior to data collection, staff conducting the weigh-off should practice and repeat the procedure to develop consistency in starting and stopping the weigh-off.
Analysis of the data
Additional columns for flour grades and byproducts may be added to the right-hand side of the chart to provide a complete mill product stream picture. The sum of each process column should be equal to the sum of the corresponding process row. The mass flow in and out of a system should be reasonably close, perhaps 5% or less difference. Likewise, the product from multiple rolls, sifters or purifies in the same processing system should also around 5% or less difference.
Greater differences should be investigated and resolved, especially when its variation exists in specific stream output between multiple sifter boxes in the same processing system. This concern is especially important in a flour stream weigh-off needed for development of a cumulative ash and will be discussed in the next article.


